Reports

The Reports section of Whiteboard provides access to various types of reports and data visualizations in the Whiteboard system to keep tabs on your team’s performance and output.
Reports are broken down into (2) types of reporting methods:
- Search Reports: Allows authorized users to search for specific data not covered by our “canned” reports.
- Reports: Predefined “canned” reports that can provide graphed results in a single click.
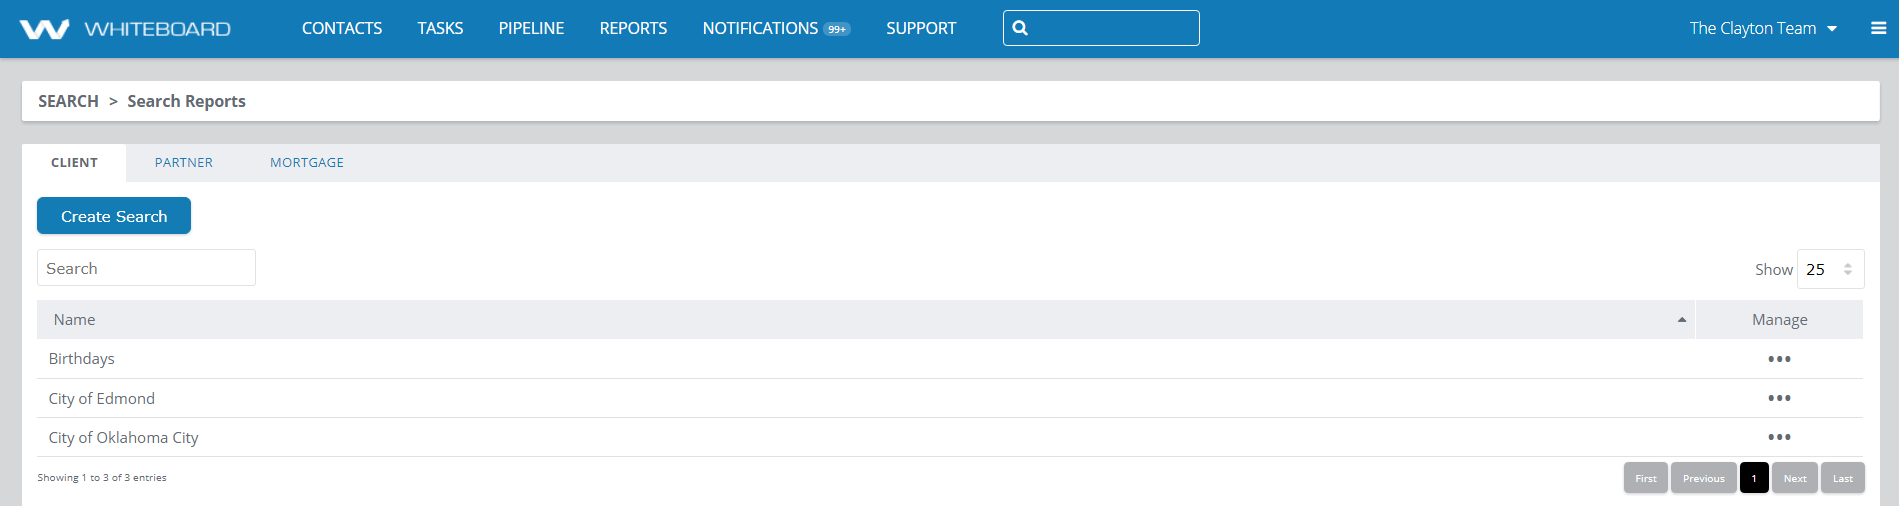
Search Reports are split out by the type of data that’s going to be searched against. You can create search reports for Clients, Partners, or Mortgages. Just like campaigns, search reports can only see the type of data they’re intended to access. Client search reports can see Client data, etc. There are no pre-made search reports. Accordingly, search reports run only for the current team they are created on and cannot be shared with other teams in multi-teamed offices
Search Report Management Options:
- Edit – Allows authorized users to modify existing search reports
- View – Returns results of the search report
- Delete – Permanently removes the search report from the view
Create Search Reports:
- To create a new search report, select the desired tab the report will be pulling from. Options are Client, Partner and Mortgage. Then click the “Create Search” button.
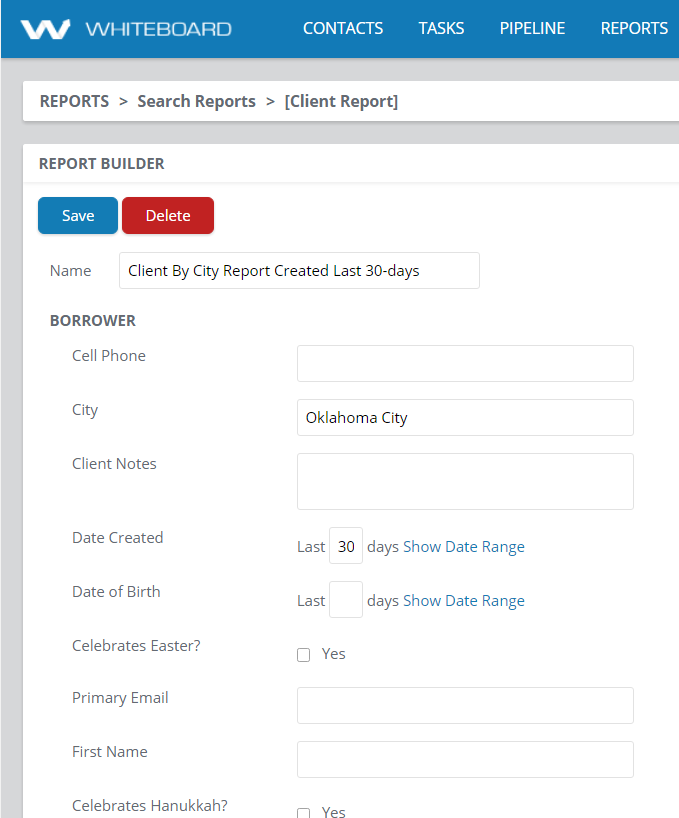
- Provide your search with a Name. Make your name clear and concise, so you can easily locate and run the same report in the future.
- Set your parameters as needed
- Save your report. Upon saving, your results will be displayed.
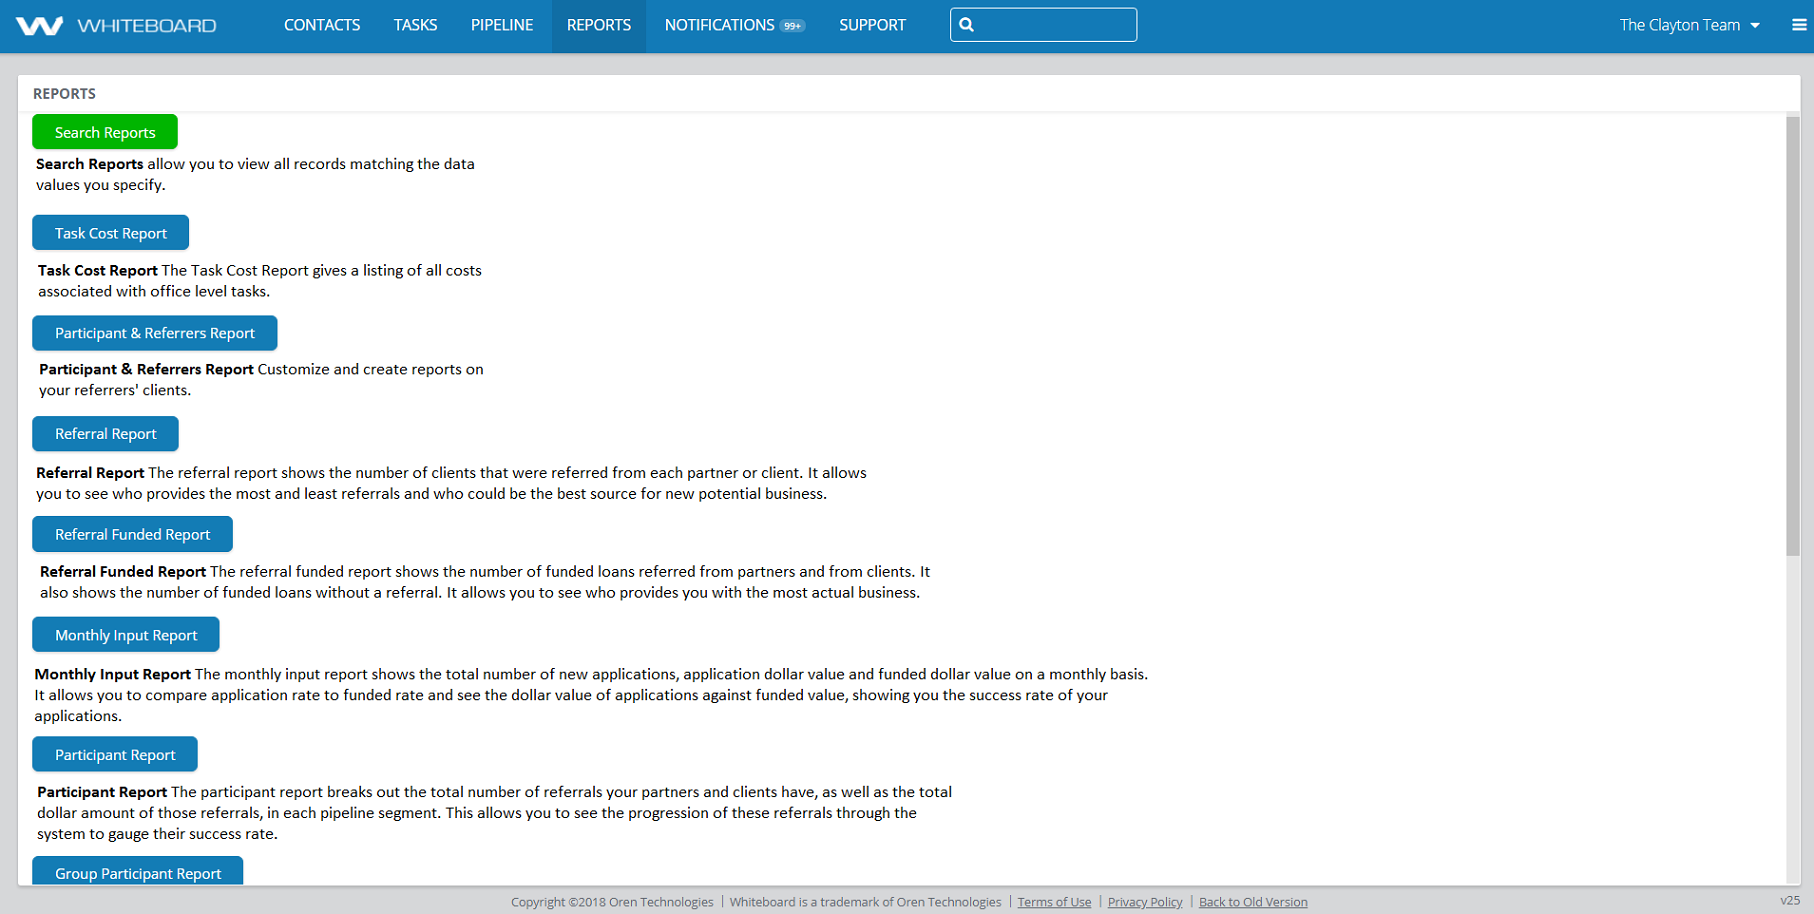
“Canned” Reports are predefined collections of data that Whiteboard makes available to you. Use these reports to keep track of your team’s performance and output. Some reports allow you to filter data, generally by date range. There are currently (12) reports and we’ve outlined them for you below:
- Task Cost Report – The Task Cost Report gives a listing of all costs associated with office level tasks.
- Participant and Referrers Report – This report shows any contact associated with a client’s mortgage record, that is partner and/or referrer based.
Note: The Participant and Referrers Report is out most popular and frequently used report. It’s important to know that the first time you run the report, it needs to be configured with filters first. This can be done via the “Show Options” button in the upper-left corner.
- Referral Report – The referral report shows the number of clients that were referred from each partner or client. It allows you to see who provides the most and least referrals and who could be the best source for new potential business.
- Referrer Funded Report – The referrer funded report shows the number of funded loans referred from partners and from clients. It also shows the number of funded loans without a referral. It allows you to see who provides you with the most actual business.
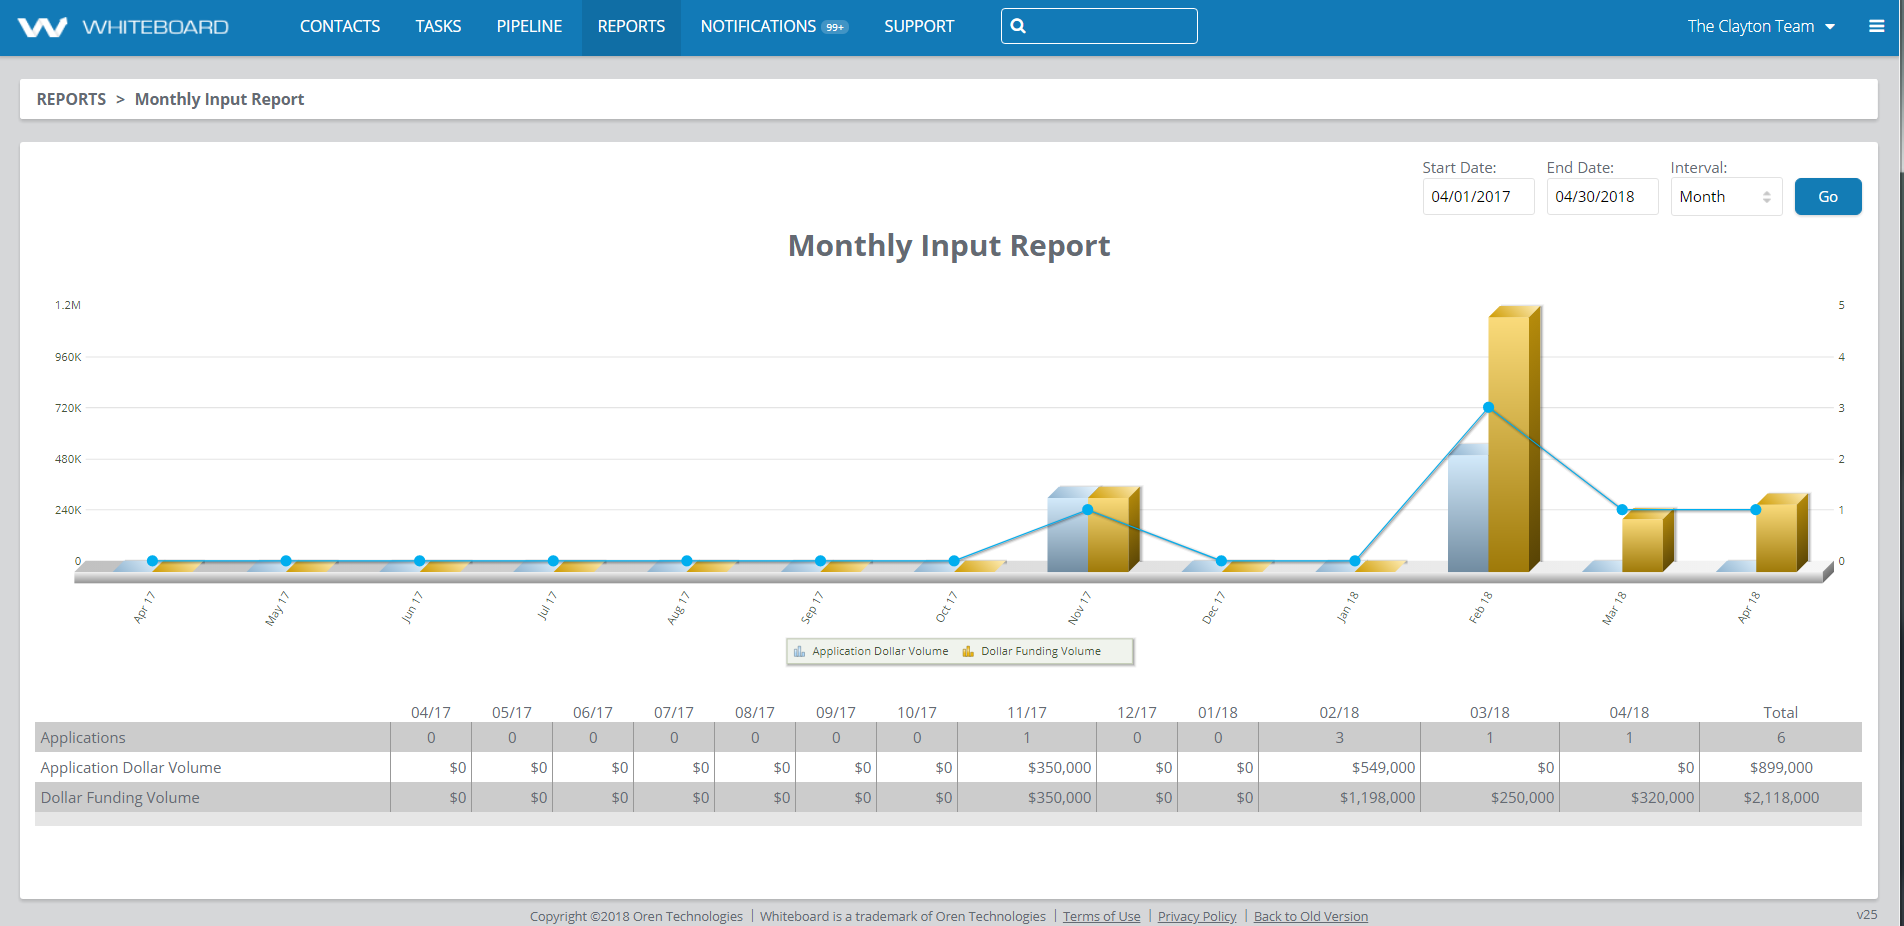
- Monthly Input Report – The monthly input report shows the total number of new applications, application dollar value and funded dollar value on a monthly basis. It allows you to compare application rate to funded rate and see the dollar value of applications against funded value, showing you the success rate of your applications.
- Participant Report – The participant report breaks out the total number of referrals your partners and clients have, as well as the total dollar amount of those referrals, in each pipeline segment. This allows you to see the progression of these referrals through the system to gauge their success rate.
- Group Participant Report – The group participant report shows you the total number of referrals and dollar value of those referrals in each pipeline segment, broken out by group. This allows you to observe the success of group referrals moving through the system.
- Funded Report – The funded report shows you the total dollar value and number of funded loans per month, within a given year. This gives you an overall look at the success of your company.
- Canceled Report – The canceled report shows you the total dollar value and number of cancelled loans per month, within a given year. This gives you an idea on how many loans are failing.
- Lead Conversion Report – The lead conversion report shows you the total number of converted leads in each pipeline segment, on a monthly basis. This lets you see how successful your teams are at moving leads through the pipeline.
- Email Opt-Out Report – The Email Opt-Out Report shows the number of users that have opted out of receiving emails.
- Email Usage Report – The Email Usage Report shows the number of emails that have been sent.
Here’s a sample of the Monthly Input Report: